Gridlines in Pivot Chart
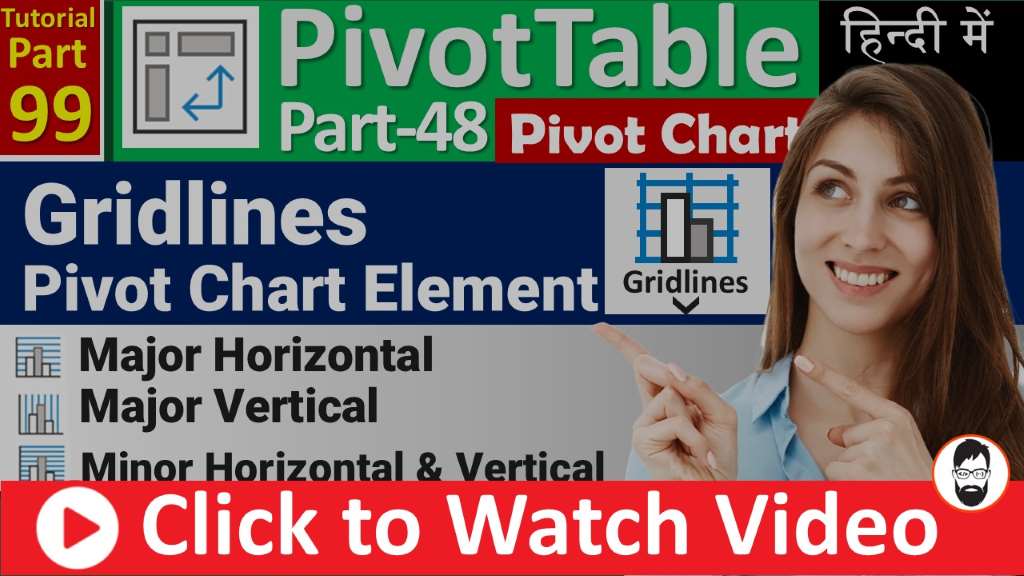
MS-EXCEL-99-Gridlines in Pivot Chart - Different Types of Gridlines - Excel Pivot Chart - in Hindi
MS-EXCEL-99-Gridlines in Pivot Chart – Different Types of Gridlines – Excel Pivot Chart – in …
MS-EXCEL-99-Gridlines in Pivot Chart – Different Types of Gridlines – Excel Pivot Chart – in …
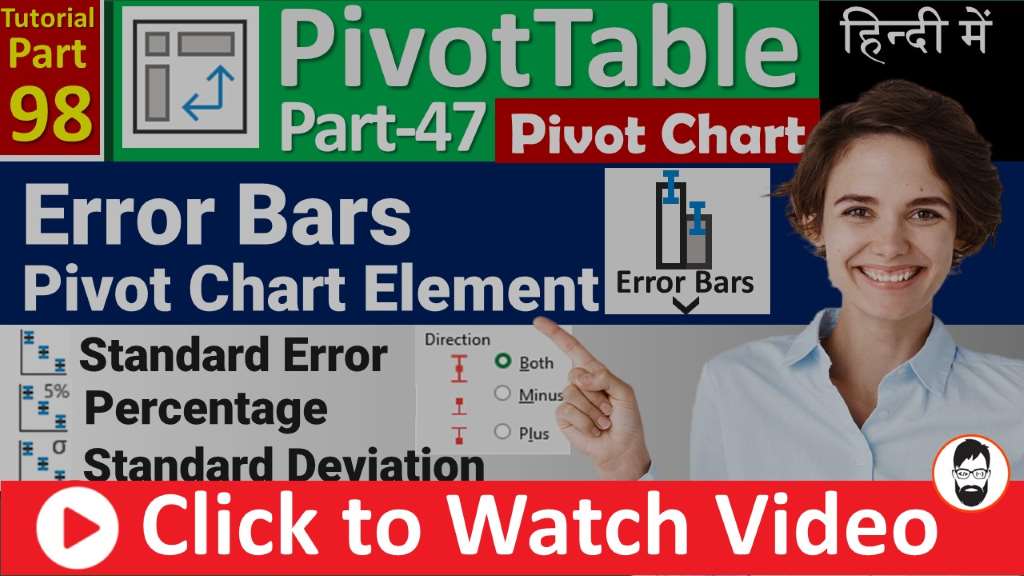
MS-EXCEL-98-Error Bars in Pivot Chart – Types of Error Bar – Set Custom Error Amount …
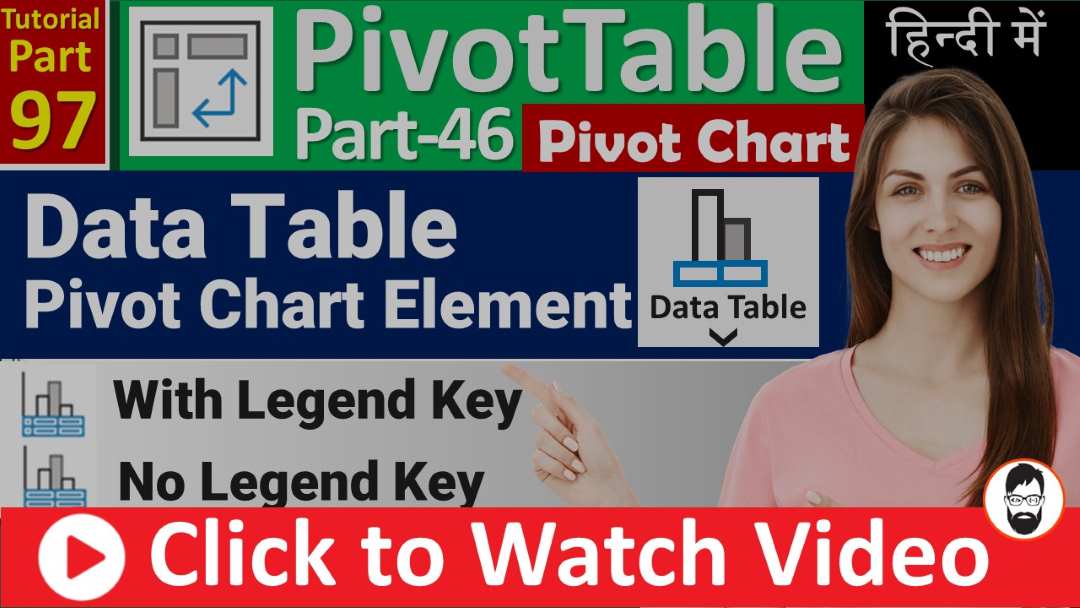
MS-EXCEL-97-Data Table in Pivot Chart – How to Add Data Table in Pivot Chart – …
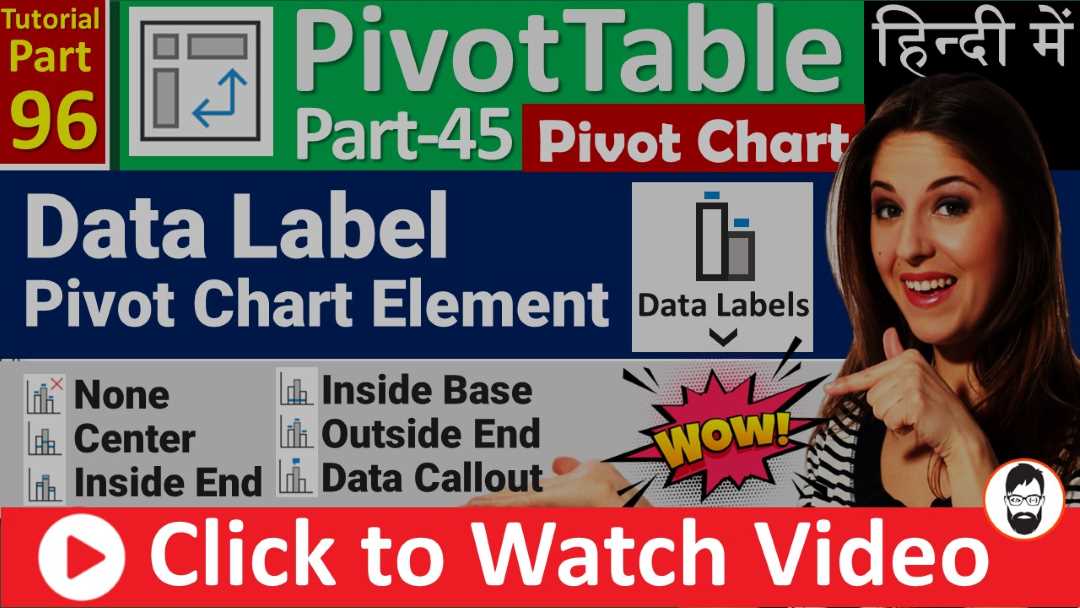
MS-EXCEL-96-Label in Pivot Chart – Label Option in Pivot Chart – Label Element – PivotChart …
PDF फाइल डाउनलोड करें? Download PDF Download Excel for Practice ———–🔵 MS Word Tutorial Playlist …
PDF फाइल डाउनलोड करें? Download PDF Download Excel for Practice ———–🔵 MS Word Tutorial Playlist …
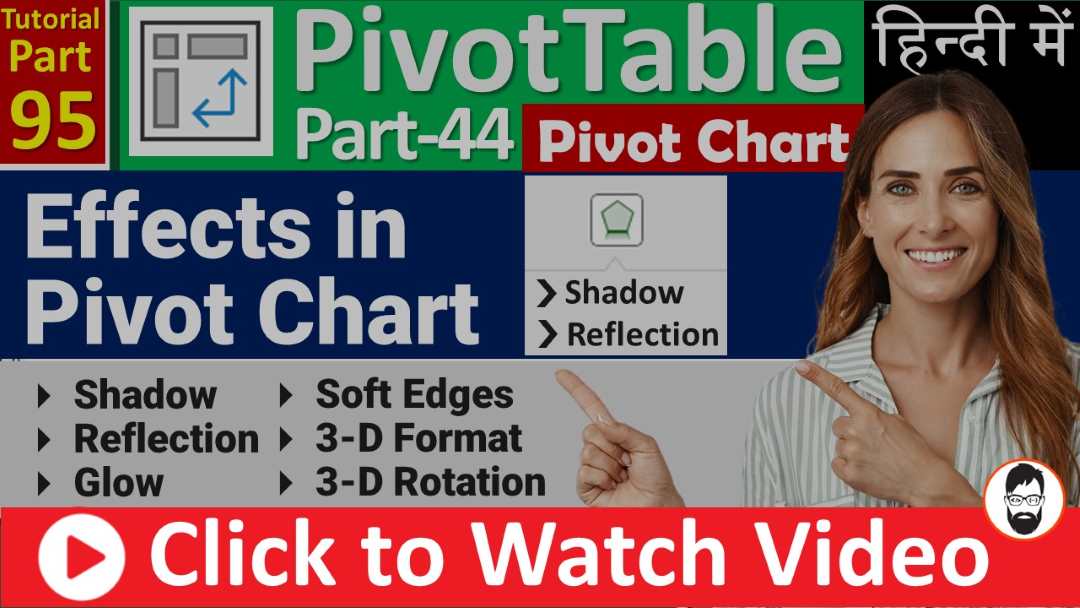
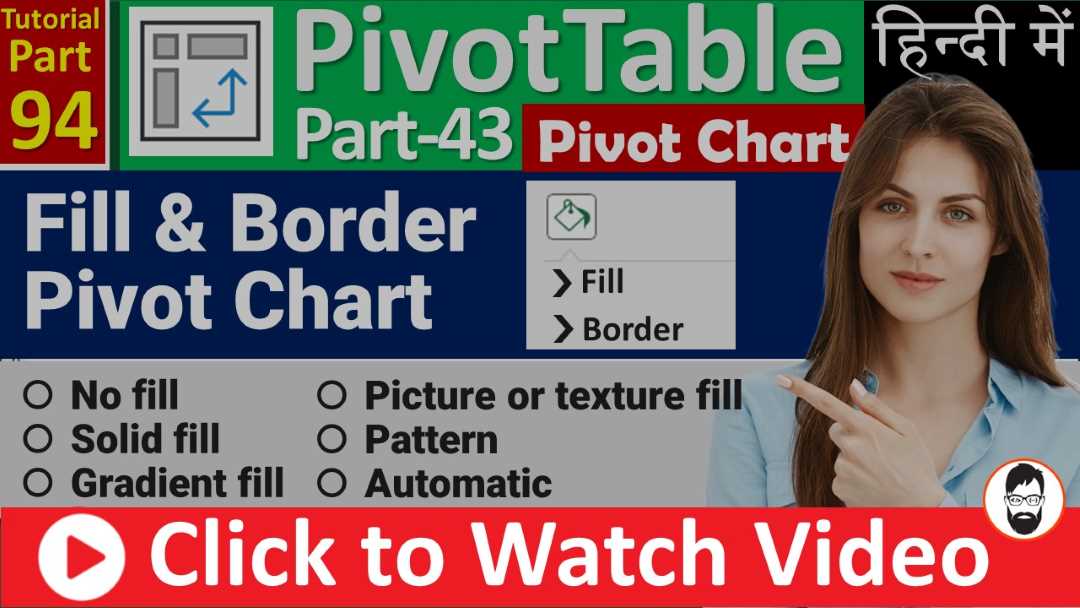
Fill and border in Pivot Chart | Solid fill | Gradient fill Read more »
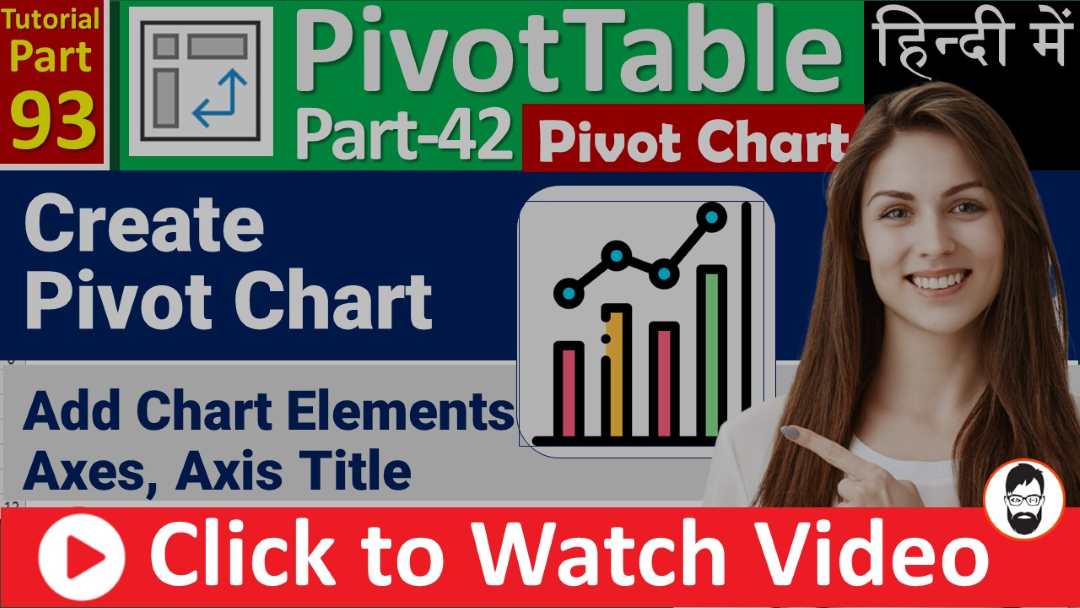
A pivot chart is a special chart created from a pivot table, which summarizes data. To make one, you start with your data table, create a pivot table to organize it, then use that pivot table to create a chart that visually shows patterns in your data.
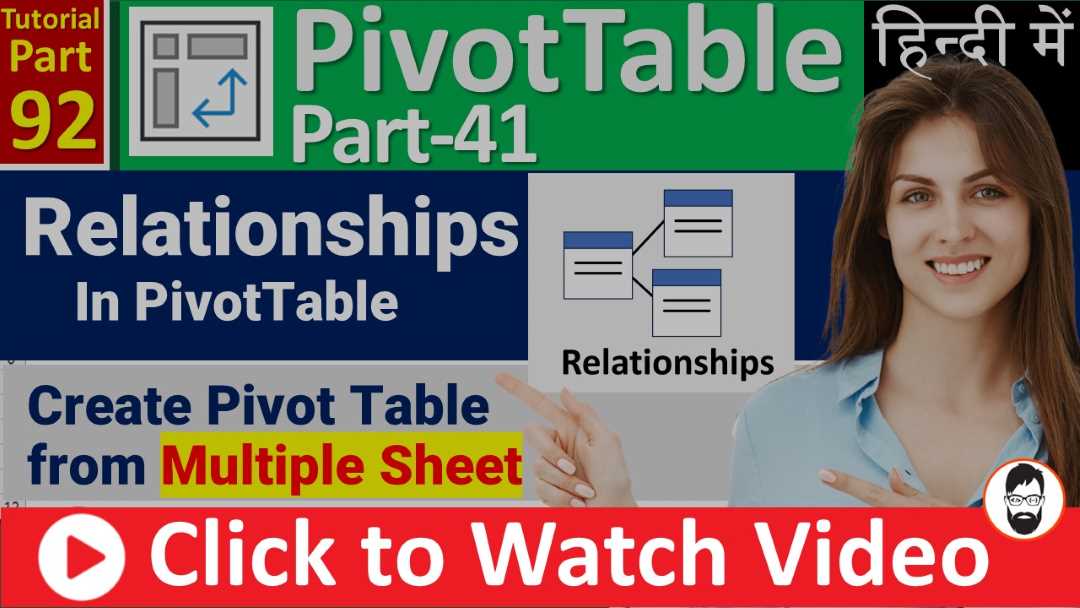
Relationships in pivot tables enable users to combine data from multiple sources or tables by establishing connections between them based on common fields.

OLAP Tools menu in PivotTable. “Offline OLAP…” option, this feature allows you to work with data from an Online Analytical Processing (OLAP) cube even when you are disconnected from the server
“Create Set Based on Column Items” groups specific items from a column together for easier analysis.